- B2B SaaS
- Enterprise UX
- NDA project
Enterprise Workforce Platform
Making complex workforce rules understandable at scale
The platform brought together recruiting, employee records, assignments, timekeeping, policy configuration, and reporting to help staffing agencies manage their operations in one place.
I led discovery research and UX/UI design and implemented most of the front end for the demo-ready MVP. The core challenge was making organizational hierarchies, labor rules, and time calculations understandable without oversimplifying the logic required for accurate results.
- Role
- UX/UI Engineer and Front-End Developer
- Timeline
- 8 months
- Team
- Cross-functional team across front-end, backend, product, sales, onboarding, and support
- Status
- Demo-ready MVP; employee-facing self-service remained at the design stage
Company and product names are withheld under NDA. The interfaces shown have been simplified, generalized, or fictionalized, and no production data is included.
The project in brief
The challenge
Staffing agencies managed recruiting, employee records, timekeeping, and reporting across disconnected systems. This created duplicated work, inconsistent or missing data, and compliance risks. Missing hours or worker records could also lead to pay disputes, while fragmented workflows remained difficult to learn and coordinate.
My role
I led the UX/UI work from discovery through implementation, using research and cross-functional collaboration to shape the product structure, workflows, and MVP priorities. I established reusable interface patterns, collaborated with engineering on data and API requirements, and implemented most of the front end.
The MVP
The team delivered a demo-ready MVP connecting agency hierarchies, policy configuration, employee records, assignments, timecards, reporting, and authentication.
Key constraints
The MVP had to support complex rules, large datasets, English and Spanish localization, accessibility, multiple integrations, and an eight-month delivery timeline.
The design challenge
Bringing these workflows into one platform was only part of the challenge. The experience also had to reveal how organizational hierarchy, policy rules, and time calculations affected one another so administrators could make accurate decisions with confidence.
01SYSTEMS
Disconnected tools fragmented the work
Recruiting, employee records, assignments, timekeeping, and reporting lived in separate systems. This created duplicate work, inconsistent data, and errors that were difficult to trace.
02HIERARCHY
Hierarchy changed how rules applied
Parent companies and local agencies shared policies, but permissions, reporting, and calculations varied according to where each rule was defined and which organization it affected.
03TRUST
Calculations had to be accurate and explainable
Overtime, breaks, rounding, and approvals affected payroll-related results. Administrators needed to see which rules applied and understand how each result was calculated.
04SCOPE
Eight months to deliver a complex MVP
I had to learn an unfamiliar domain while researching, designing, and implementing the core workflows. The MVP also had to support English and Spanish localization, accessibility, and multiple integrations.
Research defined the MVP's people and priorities
Because I was new to staffing operations, research had two goals: build my domain understanding and give the team evidence for deciding what the MVP needed to demonstrate.
- Understand the domain. I interviewed stakeholders across leadership, engineering, sales, onboarding, and support, then audited the legacy system to map existing workflows, dependencies, and recurring customer problems. User surveys and competitor research helped test internal assumptions against broader expectations.
- Model the users. I synthesized the findings into personas and journey maps for frontline workers, agency managers, and parent-company executives. These were the company’s first formal user profiles and helped shift discussions from abstract feature requests to concrete responsibilities, risks, and decision points.
- Define the MVP. The research clarified which workflows were essential to the demonstration, which system dependencies needed to appear in the interface, and which employee-facing capabilities could remain at the design stage without weakening the core platform story.
The resulting profiles revealed three levels of responsibility the platform needed to support: frontline work, agency operations, and parent-company oversight.
USER ROLE · FRONTLINE WORKER
The temporary worker
Mobile · kiosk · on the move
GOAL
View assignments, record hours, and track benefits in one place.
PAIN POINT
Scattered systems made assignments, hours, and employment status difficult to find and understand.
USER ROLE · OPERATIONS ADMINISTRATOR
The agency manager
Web dashboard · office-based
GOAL
Manage workers, assignments, timecards, and compliance from one dashboard.
PAIN POINT
Disconnected tools created duplicate entry and made follow-up work difficult to coordinate.
USER ROLE · PARENT-COMPANY EXECUTIVE
The parent executive
Enterprise dashboard · multi-agency
GOAL
Apply policy consistently across agencies and review compliance exceptions.
PAIN POINT
Limited cross-agency visibility made it difficult to identify exceptions and determine where action was needed.
CROSS-ROLE INSIGHT
One system, many needs
Shared data · role-specific views
GOAL
Give each role the right view of the same underlying operations.
PAIN POINT
Separating experiences by role could fragment information and obscure who was responsible.
Research translated organizational responsibilities into user needs, workflow priorities, and a focused MVP scope.
What shaped the product
Research surfaced three needs, and implementation revealed a separate scaling risk. Together, they became four design decisions that shaped the MVP. Each required balancing learnability, system accuracy, and implementation constraints.
01 · Making organizational hierarchy visible
CHALLENGE
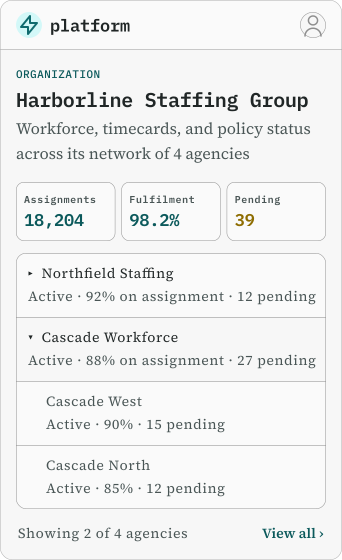
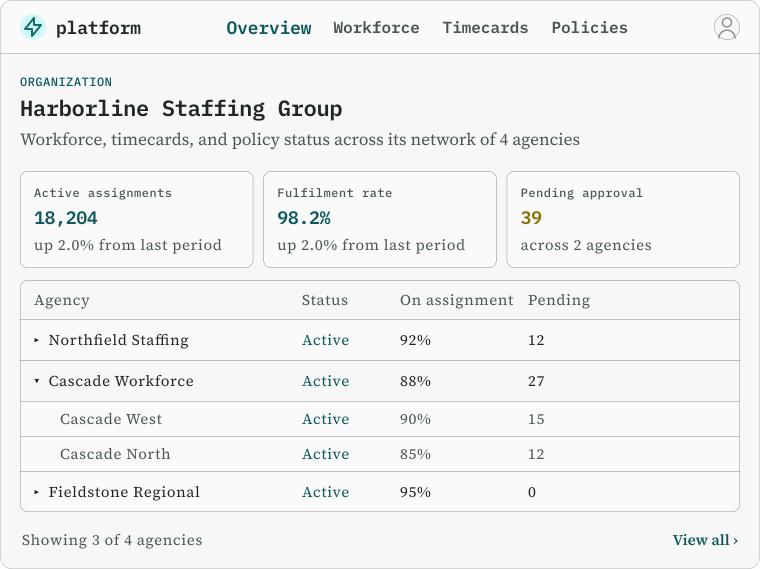
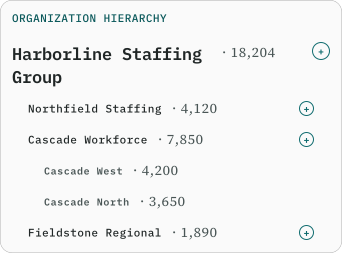
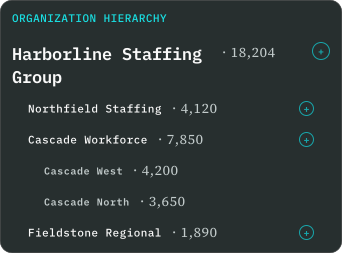
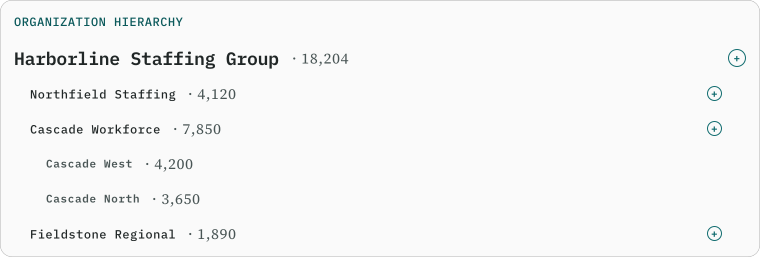
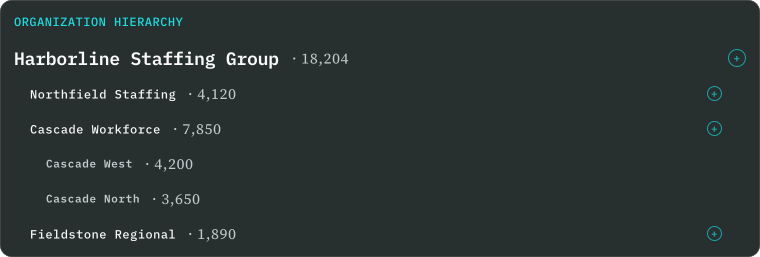
Parent-child relationships affected permissions, policies, reporting, and time calculations. A flat navigation model would have treated each agency as an isolated workspace, making it difficult for administrators to understand inherited rules, local overrides, and conflicts.
DECISION
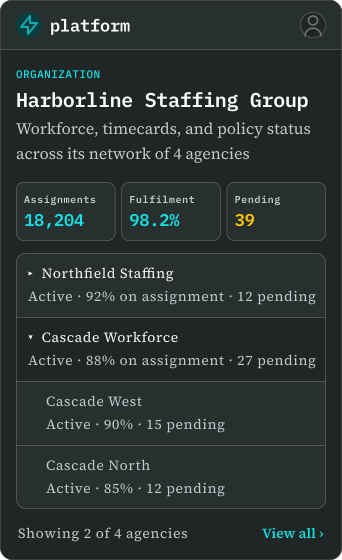
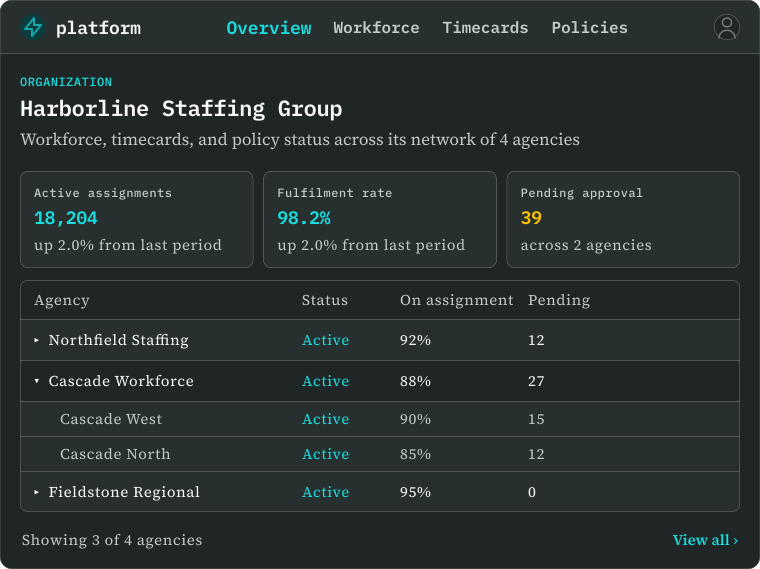
I designed hierarchy views that made agency relationships explicit and reusable across the platform. The same organizational model informed policy management, permissions, reporting, and timekeeping, allowing administrators to understand which organization they were working within and where a rule originated.
TRADE-OFF
Representing hierarchy added complexity to the navigation, but hiding it would have forced every workflow to recreate the same organizational relationships independently.
02 · Making complex policy logic learnable
CHALLENGE
Staffing agencies experienced frequent turnover, so the platform could not depend on lengthy training. This was especially important in policy configuration, where labor rules varied by state, agency, and client and could not be represented through one fixed form.
DECISION
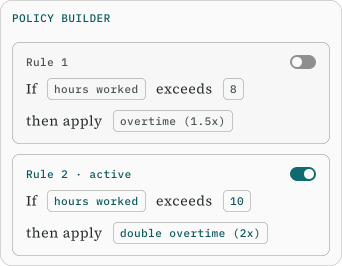
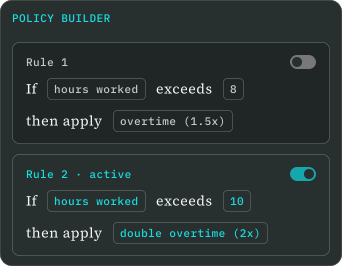
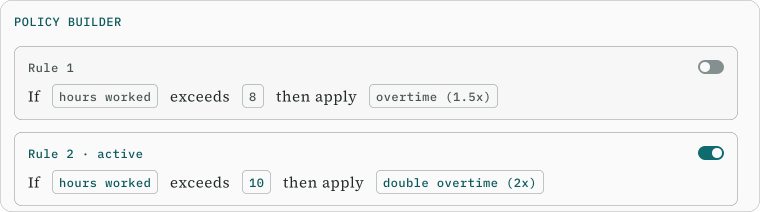
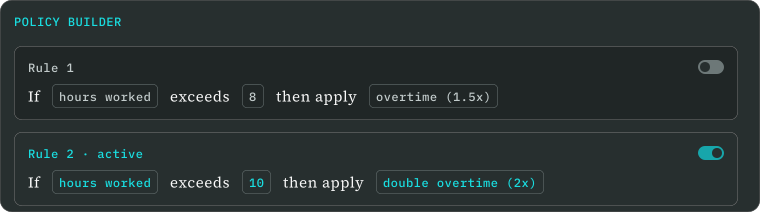
I prioritized task-focused flows, repeatable interaction patterns, plain language, and a foundation for English and Spanish localization. For policy management, I integrated the Code Effects Rule Engine into the front end and adapted its interaction patterns to the wider product. Administrators could create natural-language conditions and review each rule within the organizational context where it applied.
TRADE-OFF
Exposing every backend option would have increased flexibility but reduced comprehension. I prioritized contextual editing so administrators could understand what a rule did, where it applied, and how it interacted with the agency hierarchy.
03 · Making time calculations inspectable
CHALLENGE
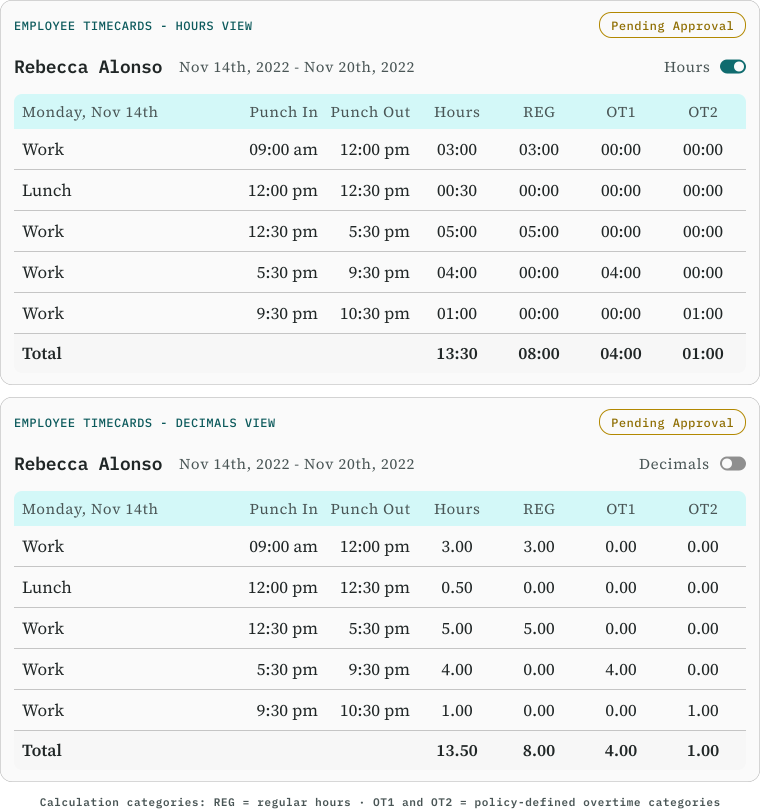
Time formats, rounding rules, approvals, and exceptions could affect payroll-related calculations, benefits, and compliance. Agencies recorded time using both decimal and hours-and-minutes formats, so small inconsistencies in conversion or rounding could compound across large datasets.
Accuracy alone was not enough. Administrators needed enough context to review edits, understand exceptions, and trust the result.
DECISION
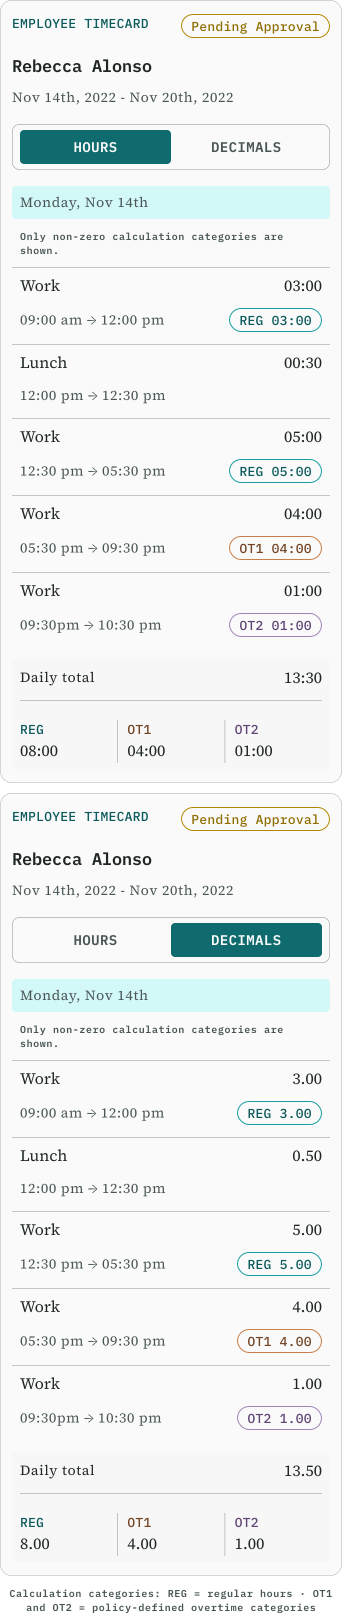
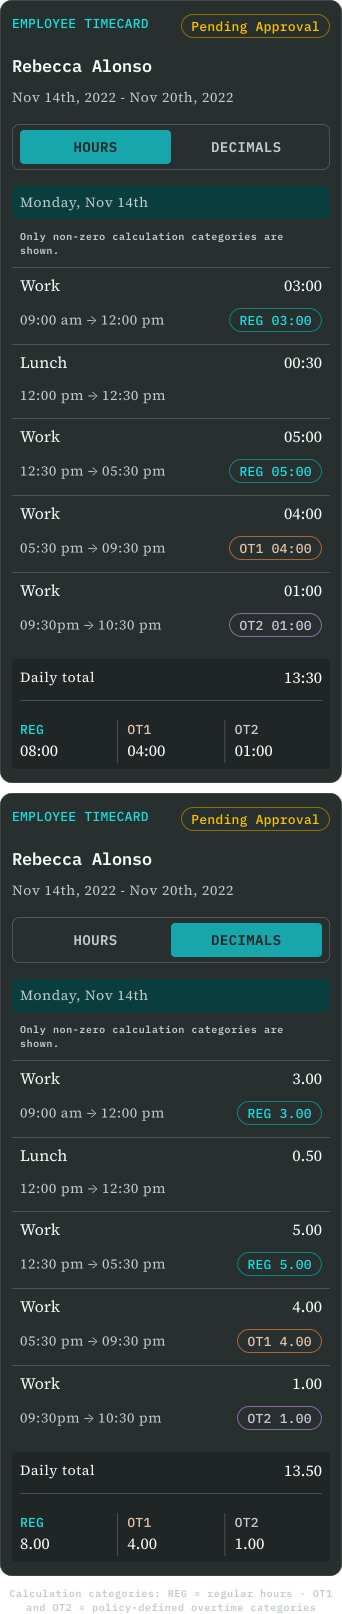
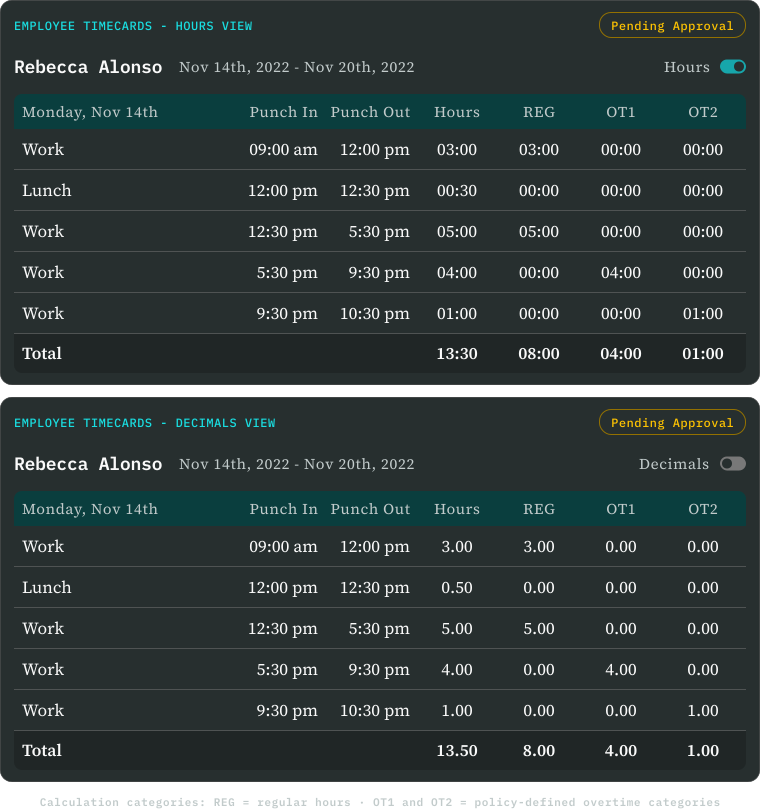
I designed timecard workflows that brought recorded hours, approvals, exceptions, calculation categories, and audit details into one reviewable experience. This allowed administrators to compare the original record with policy-defined outcomes and identify where a calculation had changed.
TECHNICAL RESPONSE
During implementation, we surfaced a decimal-time rounding issue that could produce inaccurate results at scale. I worked with backend engineering to connect the technical problem to its user-facing consequences. The calculation logic was updated to preserve fractional remainders and normalize values at the appropriate point instead of rounding too early.
TRADE-OFF
Exposing more calculation detail increased information density, but it gave administrators the context needed to review exceptions and trust the result.
04 · Balancing people-centered context with enterprise scale
CHALLENGE
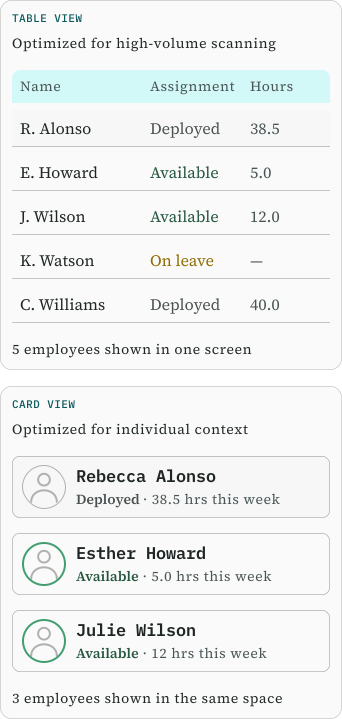
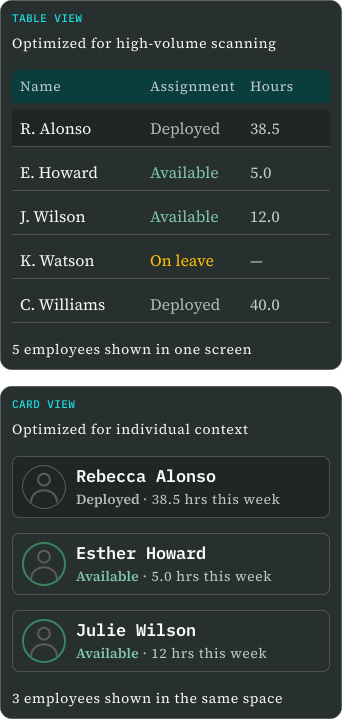
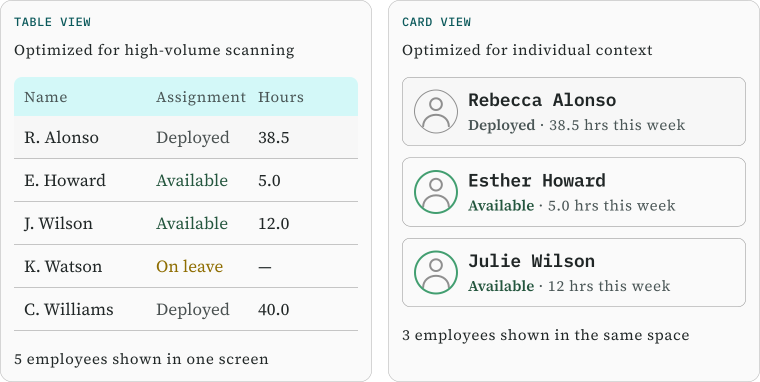
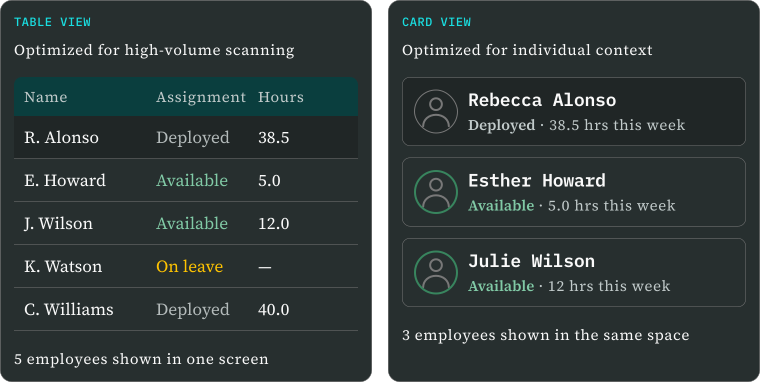
Early product direction intentionally moved away from spreadsheet-like administrative interfaces. Card-based employee views kept identity and context visible, but became inefficient as agency datasets grew into the thousands. A layout that felt approachable in a demonstration could slow scanning, comparison, sorting, and routine administration at enterprise scale.
DECISION
I defined a dual-view strategy. Cards remained available for smaller datasets and detail-focused workflows, while tables supported larger datasets where density, sorting, and comparison mattered more.
TRADE-OFF
Cards created a more approachable, people-centered experience, while tables supported faster work at scale. The product needed both rather than forcing one pattern into every context.
Where design met implementation
I implemented most of the front end alongside my UX/UI work. Working across both disciplines allowed me to test design decisions against live API responses, connected workflows, system states, performance constraints, and the practical limits of the MVP architecture.
Turning a shared design language into reusable code
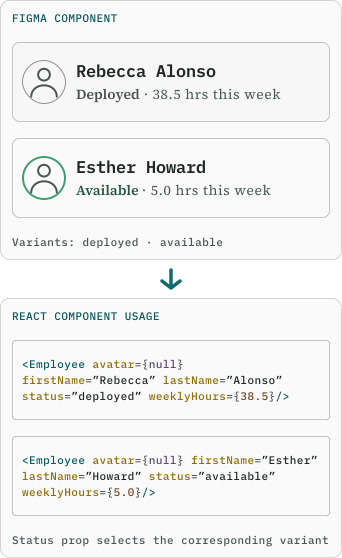
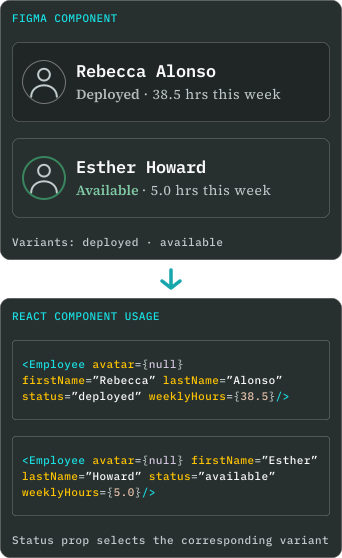
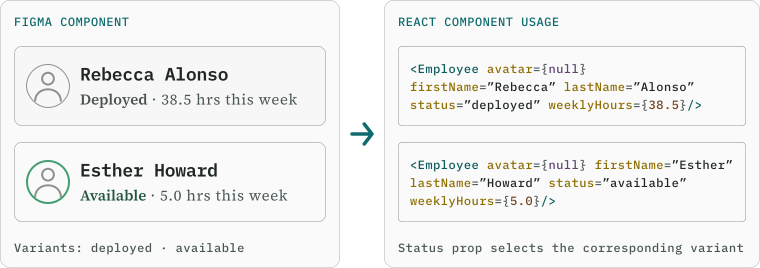
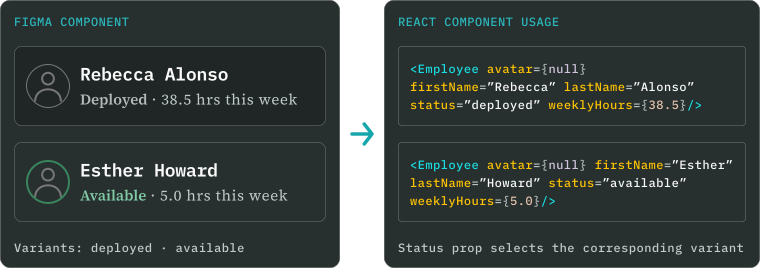
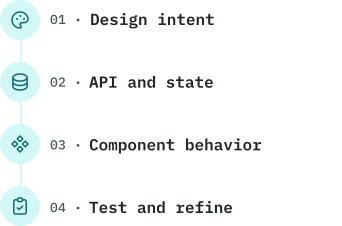
I created reusable patterns in Figma and translated them into React and Next.js components. These patterns established consistent behavior across forms, navigation, feedback states, and administrative workflows.
When workflows required more specialized behavior, I extended the component system with custom components throughout the product, including components for agency hierarchies, policy configuration, assignments, and timecard management.
Connecting interface decisions to system architecture
The platform depended on connected organizational data rather than isolated screens. A change to an agency hierarchy could affect policy scope, permissions, reporting, and timekeeping.
I worked with backend engineering to shape API responses around the intended experience. When the available data structure could not support a workflow, I proposed endpoint changes or adjusted the interaction model while preserving the underlying relationships.
Designing within technical constraints
The MVP needed authentication, English and Spanish localization, reporting, time clocks, kiosks, and support for large datasets. These requirements affected component behavior, loading and error states, validation, data handling, and future scalability.
I implemented accessibility as part of component behavior through semantic HTML, appropriate ARIA roles, keyboard navigation, and sufficient color contrast. This made accessibility part of the product structure rather than a final visual check.


Tools and technologies
- Design
- Adobe Illustrator
- Figma
- Front-end
- React
- Next.js
- TypeScript
- Data & State
- GraphQL
- Apollo Client
- Redux Toolkit
- Styling
- TailwindCSS
- styled-components
- Platform & Integrations
- Next-Auth
- next-intl
- Code Effects Rule Engine
- Exago
- Testing & Quality
- Jest
- EsLint
Validation and iteration
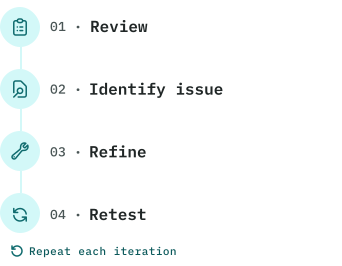
Because the MVP did not reach production during the project timeline, validation focused on internal usability reviews, stakeholder feedback, and technical feasibility testing. These methods tested whether workflows reflected the domain, organizational relationships were understandable, and connected experiences behaved reliably with the available data and integrations.
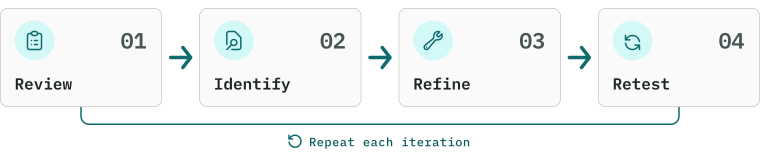
What changed through iteration
01 · Rule origin was not clear
Cross-functional stakeholder review
WHAT SURFACED
Screens showed the correct data but didn't make its organizational context obvious.
WHAT I CHANGED
Refined hierarchy views, policy scope, and inherited-vs-local states so admins can see where each rule originated and applied.
02 · Reviewers needed the full context behind a timecard
Internal usability review
WHAT SURFACED
Reviewers lacked context around edits, approvals, exceptions, and calculated results.
WHAT I CHANGED
Expanded the timecard to show recorded time, calculation categories, approval status, and audit details in one reviewable view.
03 · Card layouts became inefficient at scale
Front-end and scale testing
WHAT SURFACED
Card views stayed approachable for small datasets but made scanning and comparison slow as employee lists grew.
WHAT I CHANGED
Defined complementary card and table patterns for different data volumes, with advanced table behavior planned as a later refinement.
MVP outcome and project status
Within eight months, the team delivered a demo-ready MVP that brought the platform’s core agency and administrative workflows into one connected experience.
- Core capabilities delivered in the MVP
- Parent-child agency hierarchy
- Policy and rule configuration
- Time tracking and timecard management
- Assignments and work orders
- Reporting and data exports
- Agency-facing employee records
- Authentication
- Localization architecture and English-Spanish foundations
- Key areas deferred beyond the project timeline
- Employee-facing self-service workflows
- Complete permissions coverage across all hierarchy scenarios
- Full English-Spanish translation across every workflow
- Advanced enterprise table behavior and virtualization
These lists summarize the areas most relevant to this case study rather than the complete product scope or backlog.
Stakeholder response
Stakeholder reviews highlighted the clarity and cohesion of the MVP compared with the legacy system. The project also introduced the company’s first formal personas, journey maps, and structured usability-review process.
Project contribution
Because the MVP did not reach production, adoption metrics and live-user benchmarks were unavailable. The clearest evidence of contribution was a working demonstration of a more unified platform, a reusable design and front-end foundation for future development, and a clearer translation of complex staffing rules into usable workflows.
Reflection and next steps
What I learned
This project strengthened my ability to enter an unfamiliar enterprise domain, create structure from incomplete requirements, and make design decisions within real technical and time constraints.
I am most proud of how closely research, design, and implementation informed one another. Research helped define the MVP, design made complex rules and workflows understandable, and front-end development let me test those decisions against real data and system behavior.
What I would do next
01 ·
Research
Validate with users
Test core workflows with staffing-agency users and set task-success benchmarks.
02 ·
Engineering
Scale the tables
Complete enterprise-scale table behavior and virtualization.
03 ·
Platform
Expand access
Extend permissions and English–Spanish localization across remaining workflows.
Core takeaway
Enterprise UX is about making relationships, rules, consequences and constraints visible enough for people to act with confidence.